Welcome to “Handmade Hero Notes”, the book where we follow the footsteps of Handmade Hero in making the complete game from scratch, with no external libraries. If you'd like to follow along, preorder the game on handmadehero.org, and you will receive access to the GitHub repository, containing complete source code (tagged day-by-day) as well as a variety of other useful resources.
It's Day 10 already! Last time, we finally finished our sound (for now) and are ready to move on to new and exciting things. Today, we're going to focus on timing.
It's not as simple as it sounds. Sure, there's the concept of clock in the computer, but it's not something that gives you time. Rather, a clock is something that makes a computer tick. So what happens if we want to time something? Well, this is where things start getting interesting....
(Top)
1 Tools for Time Tracking
1.1 RDTSC
1.2 QueryPerformanceCounter
2 Time the Frames
2.1 Convert Counters into Time
2.2 Print out a Value
2.3 Calculate and Display FPS
2.4 Count the Cycles
3 Improve the Output
3.1 Print Counters in Floating Point
3.2 Double Precision
4 Recap
5 Exercises
5.1 Introduce and Use MidCounter
6 Programming Notions
6.1 Unions
6.2 Intro to Intrinsics
6.3 Dimensional Analysis
6.4 Division in C
7 Side Considerations
7.1 Intel Architecture Reference
8 Recap
9 Navigation
Tools for Time Tracking
Today, we're going to take a look at two tools to measure cycles and how much time has passed.
Processors operate in cycles. Each cycle things happen: data shifts, transistors flip some values, and you get computer magic. You know how processors tell their frequency, things like “3.2GHz”? This is 3.2 billion cycles per second. In other words, 3.2 operations per nanosecond. It's like... very fast. You know how fast it is? Light can travel only ~30 cm during that time.
Today, we're going to look at two tools which help us measure these cycles: RDTSC and QueryPerformanceCounter.
RDTSC
Somewhere in the middle of Volume 2B (as of writing, on page 547) of the Intel Architecture Reference Manual (you can learn more about it in Subsection 7.1). you will find the reference to an instruction called RDTSC. You can also find it on MSDN, too!
What is RDTSC? Well, it simply translates to "Read Time-Stamp Counter”. RDTSC is a processor-intrinsic way of getting to a special register keeping track on how many clock cycles have passed since the machine has started. This register increments every time that the CPU retires a clock cycle.
RDTSC shows you the processor cycles, expressed in terms of the processor's view of time. Unlike the real time, many processors, especially on mobile or laptops, don't always have the same clocking speed. In the effort to save energy, they might slow down or speed up, pause completely if the processor is unused, etc.
How do you do the measuring? It's simple. You get the timestamp before you start doing something, you get another one once you finished doing something, and you subtract the later timestamp from the earlier one. This difference will give you a pretty good idea of how many processor cycles have elapsed during the thing that you did.
It's important to know that this measuring is not always perfect or even precise. Keep in mind that operating system does a lot of processes in parallel, and there's only so much things a processor can do at the same time. So it's quite possible that, in the middle of execution of your code, you process was paused to give way to some other code so you aren't really measuring only your code's performance. Again, this behaviour depends on the operating systems and can vary greately.
So when you look at the cycle count, there is no constant meaning to these cycles, how long did that cycle take in the real world. They show you how much work the processor did but not how much time.
The bottom line? RDTSC numbers aren't magic, and you need to consider carefully what you get. It is a thing however that gives you a pretty raw statistics about how many cycles passed between two points, and that is quite useful.
QueryPerformanceCounter
QueryPerformanceCounter is a way of asking Windows “Hey Windows, to the best of your knowledge... What time is it on the wall clock?” It is a way of experiencing time in the “real world”, as you and we experience it.
QueryPerformanceCounter can be taken as the opposite of RDTSC. It gives the accurate measure of the real-world time passing by. Not cycle-accurate but (hopefully) more accurate than seconds or even milliseconds.
You have to remember that after all, in a 60 frame-per-second game, you only have ~16.67 milliseconds for a single frame! So that's how time you have to do work for the next frame. In those situations, measuring time in 1ms just won't cut it. Windows will try to give you as granular cut of wall clock time as possible, promising a resolution of <1μs (microsecond, a thousandth of a millisecond).
If we get a time that we can correlate with the real-world time, it helps you with your intuition. And that's important.
Time the Frames
With this long introduction out of the way, let's get to coding! We will start by doing something extremely simple. We have our loop (while (GlobalRunning)) which, while we run, our game will sit in. Let's print out some number to see how many milliseconds it took us to generate a frame.
To do that, we're going to call QueryPerformanceCounter. It's another one of those Windows functions that we've seen on this stream, and it takes something to fill out, in this case a structure called LARGE_INTEGER. Let's create a rolling counter, so that each time a frame ends it takes the count at the end of that frame.
GlobalRunning = true;LARGE_INTEGER LastCounter;
QueryPerformanceCounter(&LastCounter);while (GlobalRunning)
{
    // ...
    // The game loop
    // ...    LARGE_INTEGER EndCounter;
    QueryPerformanceCounter(&EndCounter);

    // TODO(casey): Display the value here

    LastCounter = EndCounter;}
LARGE_INTEGER is a type of structure called a “union”. Its 64 bits can be split in the 32-bit LowPart and HighPart. Since we are on the 64-bit operating system, we can go straight to accessing the 64-bit QuadPart.
The QuadPart is going to give us a 64-bit value that we know will somehow correspond to the wallclock time. Before assigning EndCounter to become the new LastCounter, we'll calculate the difference between the two and derive the actual elapsed milliseconds. The result will be stored as an s64.
LARGE_INTEGER EndCounter;
QueryPerformanceCounter(&EndCounter);

// TODO(casey): Display the value heres64 CounterElapsed = EndCounter.QuadPart - LastCounter.QuadPart;
LastCounter = EndCounter;Let's look again at what we're doing here.
- Before entering main loop: Declare a counter and measure the timestamp.
- Do whatever we need to do in our loop and measure the timestamp at the end.
- Take the two times, subtract the later from the earlier, and get how much time elapsed.
- To repeat the cycle, we pretend that now the
LastCounteris the counter we just measured in step 2. - Repeat 2-4 forever.
We could simply say BeginCounter at the very top and EndCounter at the bottom but.... technically, it doesn't capture all the time. If getting back to the top of the loop takes some time (maybe process got switched out, or something else happened), we'd miss that time. This approach guarantees to never miss any time, because we have only one single place where we check the clock, and then measure the time on our last run on the same spot.
Convert Counters into Time
We now have the CounterElapsed value which tells us how many “counters” passed. Unfortunately, we still don't know how to interpret that value. If we want to translate these counters to the human-readable wall clock time instead of machine-readable time, there's a handy function allowing us to convert one into the other.
QueryPerformanceFrequency tells us how many increments does the clock go through in one second. This frequency is not allowed to change, so we can only check it once at the beginning of our program. So let's check this frequency at the beginning, when we are doing the rest of init code. Since we don't need the whole result of the query, we can discard it and only use the QuadPart.
int CALLBACK
WinMain(HINSTANCE Instance,
        HINSTANCE PrevInstance,
        LPSTR     CommandLine,
        int       ShowCode)
{    LARGE_INTEGER PerfCountFrequencyResult;
    QueryPerformanceFrequency(&PerfCountFrequencyResult);
    s64 PerfCountFrequency = PerfCountFrequencyResult.QuadPart;    // ...
}Now, when we get at the very end of the frame, we can say: we know how many counters have elapsed, and we know how many of them happen in a second. We can trivially apply what's called Dimensional Analysis to know that, in order to get the seconds elapsed, we should divide the counts by counts per second.
Now, both the CounterElapsed and PerfCountFrequency are integers, so diving one over the other will invariably give us 0 (we hope at least that our frames take less than one second to make!). So measuring in seconds is not particularly useful. We could multiply CounterElapsed by 1000 first so, when dividing by the frequency in seconds, we'll get milliseconds count (sort of how you would calculate a percentage of something). Also we don't need to store this value in as an s64, s32 will suffice.
LARGE_INTEGER EndCounter;
QueryPerformanceCounter(&EndCounter);

// TODO(casey): Display the value here
s64 CounterElapsed = EndCounter.QuadPart - LastCounter.QuadPart;s32 MSPerFrame = (s32)((1000*CounterElapsed) / PerfCountFrequency);LastCounter = EndCounter;Print out a Value
We now have a value showing how many full milliseconds it took us to make a full game cycle. This value will of course vary as the game goes, and the first frame usually takes the longest. Let's print it out to our Output console!
But... how? We know there's OutputDebugStringA function which allows us to print a string we want, but so far we only dealt with predefined strings.
If you had to do with Python, JavaScript or another high level language, your first impulse would be to simply type something like "ms/frame: " + MSPerFrame. This will not work in C. Once we get more of our own code up and running, we will come up with a custom solution that we'll design; for now, let's use whatever Windows provides by default.
If you want to quickly print out strings in Windows, you can use a function called wsprintf (which comes with A or W variants). This function allows you to format and write a string to some buffer (memory). It takes the following parameters:
- A buffer (usually an array of
chars of some length). - A “format string”, including the keywords to insert the values into.
- The values you want to insert into the string.
In our case, this will look something like this:
s64 CounterElapsed = EndCounter.QuadPart - LastCounter.QuadPart;
s32 MSPerFrame = (s32)((1000*CounterElapsed) / PerfCountFrequency);char Buffer[256];
wsprintfA(Buffer, "ms/frame: %dms\n", MSPerFrame);
OutputDebugStringA(Buffer);LastCounter = EndCounter;The way the string formatting works comes from long ago, defined by the C standard committee and adopted by Windows, as well:
- In the format string, data will be written to the
Buffernormally until%sign is hit. - After encountering
%sign, the function will try to insert the next unused value after the comma, formatting it in the way requested (in our case, we request%d, i.e. format it as an integer). - The final
Bufferis passed toOutputDebugStringA.
% things assume to line up with whataver values you're passing next, you can start reading from the stack something you never passed or even outright crash!
There are versions of these functions that help navigate around these problems (for instance, wnsprintf requests the length of the buffer to not go overboard). Still, this is not the code that you should be using in anything more than for debug purposes. You wouldn't really want to ship this code, or if you want, you really need to understand what you're doing.
Let's compile and test it out in the debugger. Run your program for a few seconds and inspect the Output window:
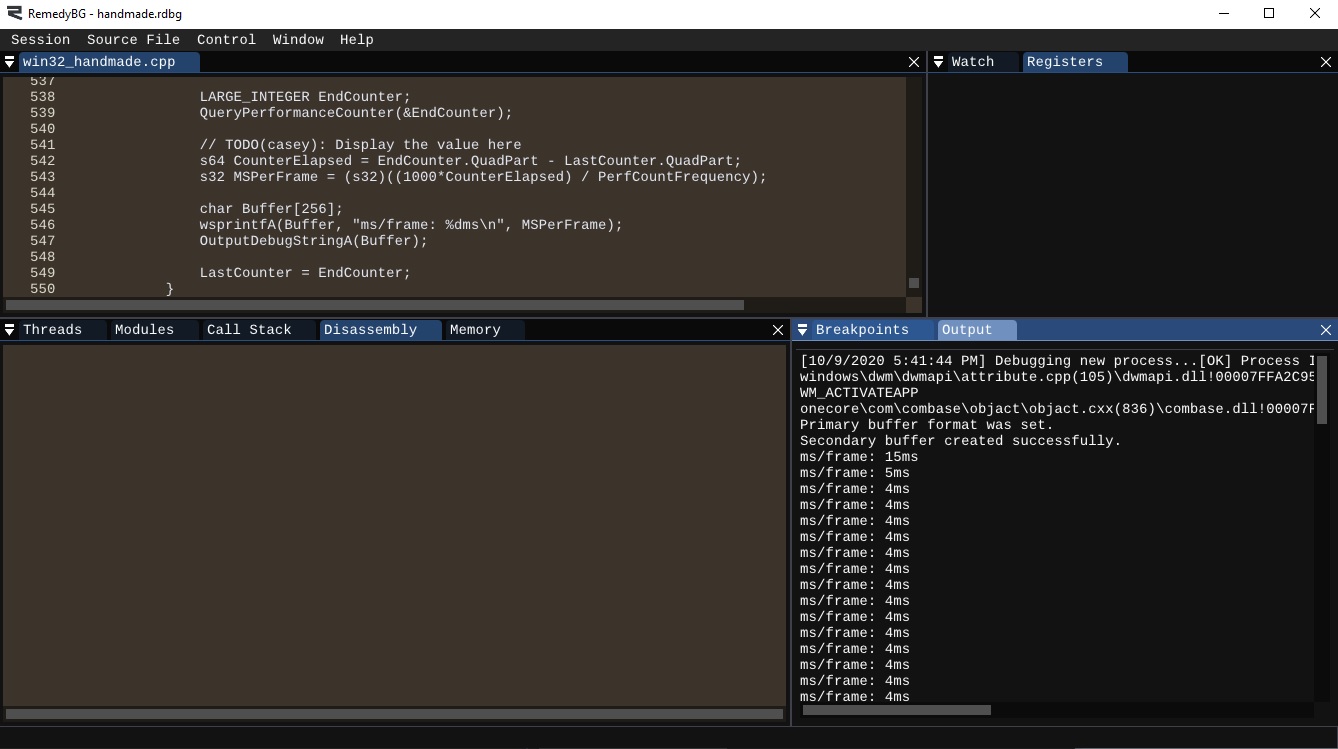
You'll notice that the first frame was indeed pretty long (15ms) while the rest oscillated between 4ms, sometimes 5ms frames. Your framerate will be more or less stable depending on your processor, as well as how many other processes you're running.
Calculate and Display Frames per Second
Programmers usually think in terms of milliseconds per frame. However, you might be used to think of a game performance in terms of frames per second. Let's convert one into the other using the powers of Dimensional Analysis!
We know that we have our \(counts\) (that in this case we can consider \(\frac{counts}{frame}\)). We need \(\frac{counts}{second}\) to get to \(\frac{frames}{second}\), and we'll also need to flip our \(\frac{counts}{frame}\).
So this is how the whole analysis looks like:
$$1\div\frac{counts}{frame} \rightarrow \frac{frames}{count}$$ $$\swarrow$$ $$\frac{frames}{count} \times \frac{counts}{second} =$$ $$\frac{frames \times counts}{count \times second} =$$ $$\frac{frames \times \bcancel{counts}}{\bcancel{count} \times second} =$$ $$\frac{frames \times 1}{1 \times second} =$$ $$\frac{frames}{second}$$
Since we have our CounterElapsed and our PerfCountFrequency, in practice all we need to do is to apply the following conversion:
$$fps = 1 \div counter \times frequency$$
This can be simplified even further by flipping the \(frequency\) in place of the \(counter\):
$$fps = frequency \div counter$$
We can now compute this down and add it to our wsprintf:
s64 CounterElapsed = EndCounter.QuadPart - LastCounter.QuadPart;
s32 MSPerFrame = (s32)((1000*CounterElapsed) / PerfCountFrequency);s32 FPS = (s32)(PerfCountFrequency / CounterElapsed);char Buffer[256];wsprintfA(Buffer, "ms/frame: %dms / %dFPS\n", MSPerFrame, FPS);OutputDebugStringA(Buffer);
LastCounter = EndCounter;If you compile and run it now, you should see the frames per second displayed alongside your ms per frame value.
Dimensional analysis is a handy tool that can come in handy if you get confused how to compute one value or another.
Count the Cycles
Let's augment our debug counters by adding the cycle counts from RDTSC. Thankfully, you can use RDTSC without any libraries, as usually compiler provide intrinsic functions to call these instructions. For Visual Studio compiler, this function is called __rdtsc(MSDN).
Similarly to what we did with the QueryPerformanceCounter, we'll create a rolling counter:
LARGE_INTEGER LastCounter;
QueryPerformanceCounter(&LastCounter);u64 LastCycleCount = __rdtsc();GlobalRunning = true;
while (GlobalRunning)
{
    // ...
    // The game loop
    // ...
    LARGE_INTEGER EndCounter;
    QueryPerformanceCounter(&EndCounter);    u64 EndCycleCount = __rdtsc();    s64 CounterElapsed = EndCounter.QuadPart - LastCounter.QuadPart;
    s32 MSPerFrame = (s32)((1000*CounterElapsed) / PerfCountFrequency);
    s32 FPS = (s32)(PerfCountFrequency / CounterElapsed);

    char Buffer[256];
    wsprintfA(Buffer, "ms/frame: %dms, %dFPS\n", MSPerFrame, FPS);
    OutputDebugStringA(Buffer);

LastCounter = EndCounter; LastCycleCount = EndCycleCount;}You now can use this counter to report the pure cycles elapsed. However it's going to be a lot. So let's say we want to count MegaCycles, or how many million cycles happened per frame.
s64 CounterElapsed = EndCounter.QuadPart - LastCounter.QuadPart;s64 CyclesElapsed = EndCycleCount - LastCycleCount;s32 MSPerFrame = (s32)((1000*CounterElapsed) / PerfCountFrequency);
s32 FPS = (s32)(PerfCountFrequency / CounterElapsed);s32 MegaCyclesPerFrame = CyclesElapsed / (1000 * 1000);
char Buffer[256];wsprintfA(Buffer, "%dms/f, %df/s, %dMc/f \n", MSPerFrame, FPS, MegaCyclesPerFrame);OutputDebugStringA(Buffer);Now you might look at that format string and say: “What is going on there?” Let's look at every single piece of it again:
%dms/f: takes the first value (MSPerFrame), interprets it as a 32-bit integer, converts it to string, and adds “ms/f” (milliseconds/frame) at the end.%df/s: takes the second value (FPS), interprets it as a 32-bit integer, converts it to string, and adds “f/s” (frames/second) at the end.%dMc/f: takes the third value (MegaCyclesPerFrame), interprets it as a 32-bit integer, converts it to string, and adds “Mc/s” (megacycles/second) at the end.\n: adds a newline character.
If you're still confused, you can write this line as %d ms/f, %d f/s, %d Mc/f \n or in any other way that makes things clearer for you.
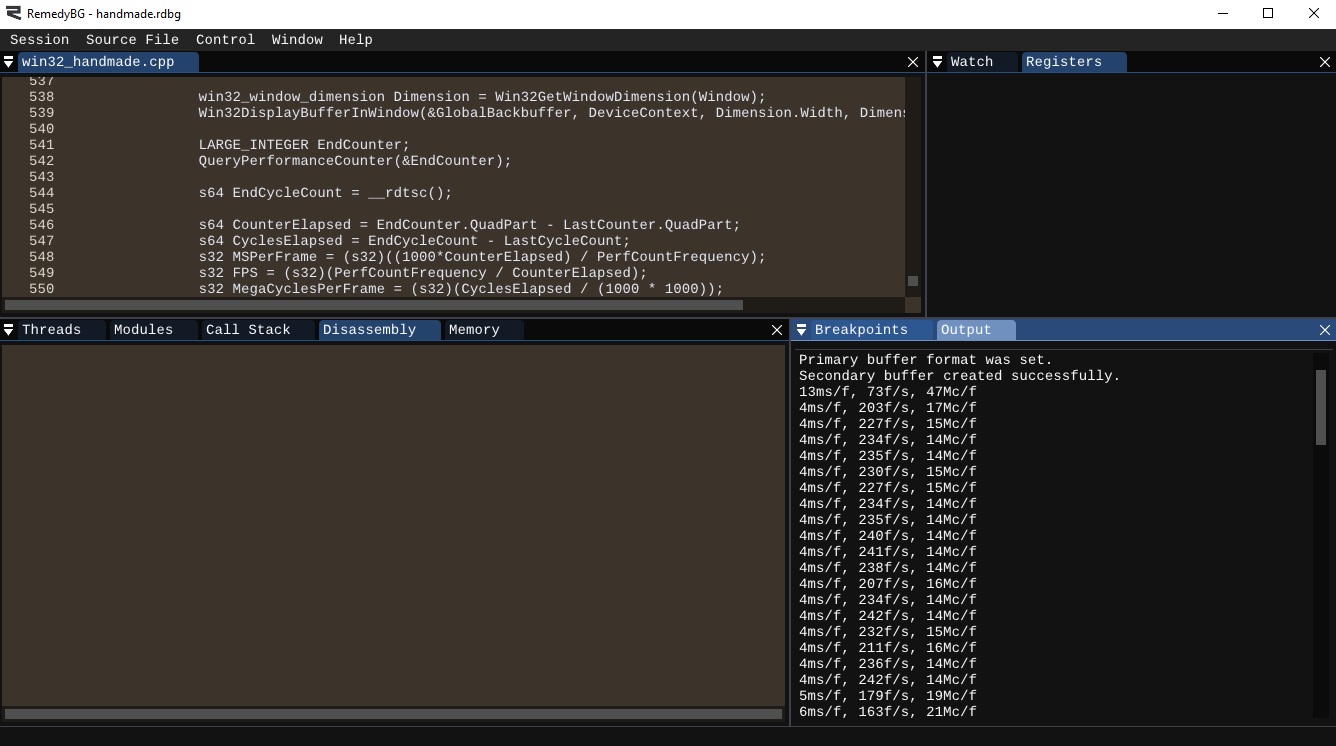
Improve the Output
If you look at the output on the figure above, you will see that our output oscillates somewhere between 14 and 21 million instructions per frame. That's a lot. And if you take a calculator and try to cross-check, you'll see that by multiplying the number of frames per second with the detected cycle count, you'll get close to your processor frequency!
Can we have even more precision? Of course, by using the floating-point fractions!
Print Counters in Floating Point
Working with the floating point is more complex in the printf-style formatting functions than with the integers. So if you inspect the documentation for wsprintfA, you'll see that it doesn't support floating-point values. We'll need to use C Standard Library analogue for that, sprintf.
sprintf works in pretty much the same way as wsprintf. Simply change the function:
char Buffer[256];sprintf(Buffer, "%dms/f, %df/s, %dMc/f \n", MSPerFrame, FPS, MegaCyclesPerFrame);OutputDebugStringA(Buffer);
Now however your program won't compile: to fix that, you'll have to simply add the stdio.h header file.
#include <windows.h>
#include <stdint.h>#include <stdio.h>#include <xinput.h>
#include <dsound.h>
// TODO(casey): Implement sine ourselves
#include <math.h>
Now your program will compile, and you'll notice that there is effectively no difference, except now you can go and use %f to output floating-point values.
At its simplest, we can simply replace %d with %f, and define our values as f32:
s64 CounterElapsed = EndCounter.QuadPart - LastCounter.QuadPart;
s64 CyclesElapsed = EndCycleCount - LastCycleCount;f32 MSPerFrame = 1000.0f*(f32)CounterElapsed / (f32)PerfCountFrequency;
f32 FPS = (f32)PerfCountFrequency / (f32)CounterElapsed;
f32 MegaCyclesPerFrame = (f32)CyclesElapsed / (1000.0f * 1000.0f);
char Buffer[256];sprintf(Buffer, "%fms/f, %ff/s, %fMc/f\n", MSPerFrame, FPS, MegaCyclesPerFrame);OutputDebugStringA(Buffer);
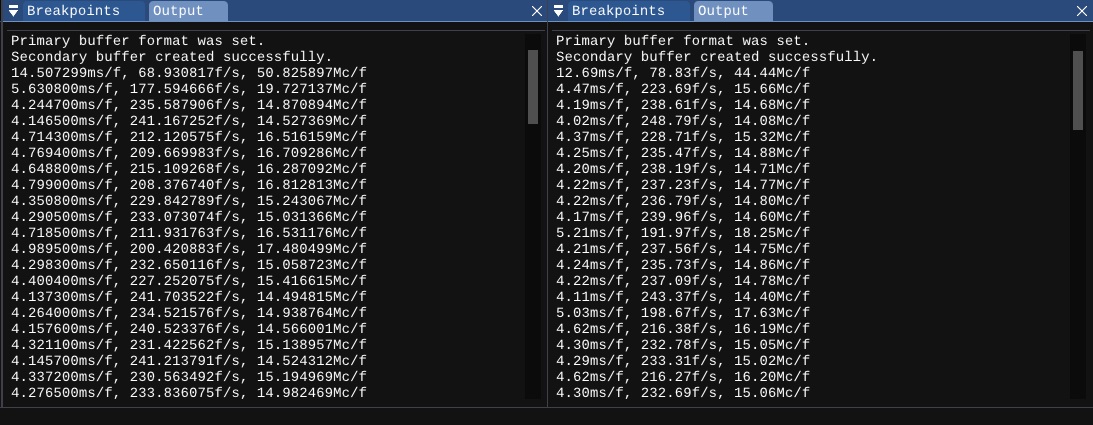
s64 to s32. If you're curious a bit how C handles division based on type, check out subsection 6.4.If you run the program now, you'll notice a lot of fractional precision in your numbers. It's definitely a good thing, as it allows us to accurately calculate the time spent on a frame, but it also might be quite confusing to look at.
This is where the so-called “format specifiers” come into play. You might want to, for example, specify to which decimal to round the value, and the format specifiers allow you to do so. If you look on MSDN, you will find a reference page called "Format Specification Syntax". The page itself is long and confusing because printf itself has long and confusing history. You can look at all these things when you need them, as they are all the various things you can use to encode your preferences in that % notation.
So for example if we say %.02f instead of %f, the values will be rounded to the second decimal point.
char Buffer[256];sprintf(Buffer, "%.02fms/f, %.02ff/s, %.02fMc/f\n", MSPerFrame, FPS, MegaCyclesPerFrame);OutputDebugStringA(Buffer);
We'll not ponder much longer on printf-like functions. It's not something that we're going to dive much deeper into, as we'll be focusing on making everything from scratch ourselves. That said, it's not a waste of time if you want to learn ins and out of the standard library. You can call them when you're trying to get the things working. Since it's a C Standard Library, it exists everywhere, and each C compiler must implement them to be standard-compliant.
That said, it's never a bad idea to use the standard library when you're only getting started in your project. There are many similar ones (printf outputs result to a console, fprintf to a file, sprintf to a buffer, the list goes on) and once you've learned one, you've learned them all. You need temporary pillars to lay your weight upon while you're raising up the dome of your own program. Just remember to remove them eventually.
Double Precision
Let's go crazy, and increase the level of accuracy even further. Of course, with only two decimal numbers it doesn't matter, but let's assume you want really refined value. You need to remember that a floating point value has only 23 bits of accuracy in it (which translates to six-and-a-bit decimal digits of precision), but we have up to 64 bits of number coming in. Of course, technically there isn't going to be a huge number after the subtraction in this specific case, but let's assume that we time something really long, some value that a 23-bit mantissa cannot hold (like ~50,000,000,000).
So in order to that you need to change how you cast your numbers...
f64 MSPerFrame = 1000.0*(f64)CounterElapsed / (f64)PerfCountFrequency;
f64 FPS = (f64)PerfCountFrequency / (f64)CounterElapsed;
f64 MegaCyclesPerFrame = (f64)CyclesElapsed / (1000.0 * 1000.0);
and that's it. printf is already treating the numbers you pass as if they were 64-bit, so you don't need to put a new keyword to them.
Now you aren't going to see any difference in this case because, as we said, single-precision floating point is more than enough for what we're doing. But you could do it anyway if you so prefer. That said, double precision doesn't come for free, and it's not magic (neither is float as well...). You can read more about it here, just be careful not to fall into a rabbit hole!
Recap
We now set the foundations for the timing in our program. In the future, we will implement platform-independent functions that the game will be able to take advantage of to know how much time has passed for its various purposes. We will also be able to split the frame counters in more parts, allowing us to verify how long this or that part of the game takes.
We have set most of the outlines for the basic elements we might need in a game:
- A render buffer to draw our frame into
- Input from a controller or a keyboard
- Sound output
- Frame timing
We might only need but a single other component (something allowing us to read from and write to files) but even that is not important for the time being. Next time, we'll start thinking about how we're going to pass all this information to our game.
Exercises
Introduce and Use MidCounter
Try to introduce a MidCounter. It will sit somewhere before Win32DisplayBufferInWindow is called, and will show you the information about all the program up to that point. Display information about it in the output window!
Programming Notions
Unions
A union is a simple but powerful concept. It overlays the same memory with several types, allowing you to access said memory in multiple ways (without having to do type casting). Unlike structs, each member of a union occupies the same space in memory.
For instance, let's take the definition of a LARGE_INTEGER:
typedef union _LARGE_INTEGER {
  struct {
    DWORD LowPart;
    LONG  HighPart;
  };
  struct {
    DWORD LowPart;
    LONG  HighPart;
  } u;
  LONGLONG QuadPart;
} LARGE_INTEGER;
LARGE_INTEGER has 3 components:
struct: “anonymous” struct, composed of 2× 32-bit members.struct u: composed of 2× 32-bit members.LONGLONG QuadPart: a 64-bit type.
If LARGE_INTEGER were a struct, the size of the struct would be \(64 \times 3 = 192\) bits. However, since it's declared as a union, its size is only 64 bits, and you can access it using any of these methods:
- You can say
LargeInteger.QuadPartto access its 64-bit component. - You can say
LargeInteger.LowPartto access its “low” 32-bit component. - You can say
LargeInteger.HighPartto access its “high” 32-bit component. - You can even say
LargeInteger.u.LowPartto access a “low” 32-bit component of theustruct.
(provided your LARGE_INTEGER's variable name is LargeInteger).
We'll meet unions in the future again, however not as much as structs.
(Back to Subsection ?)
Intro to Intrinsics
We really will touch on intrinsics later, but since we started talking about them here, a short introduction is in place.
Intrinsics are something that look like a function call. For instance, __rdtsc looks like a function, behaves like a function... but isn't really a function.
In reality, it's a hint to the compiler that you want to do a specific assembly-language instruction. After seeing an intrinsic command, the compiler will be able to directly inline the necessary instructions without thinking about referencing some other piece of code.
It's easy to see this by analyzing the disassembly at the place of the call:
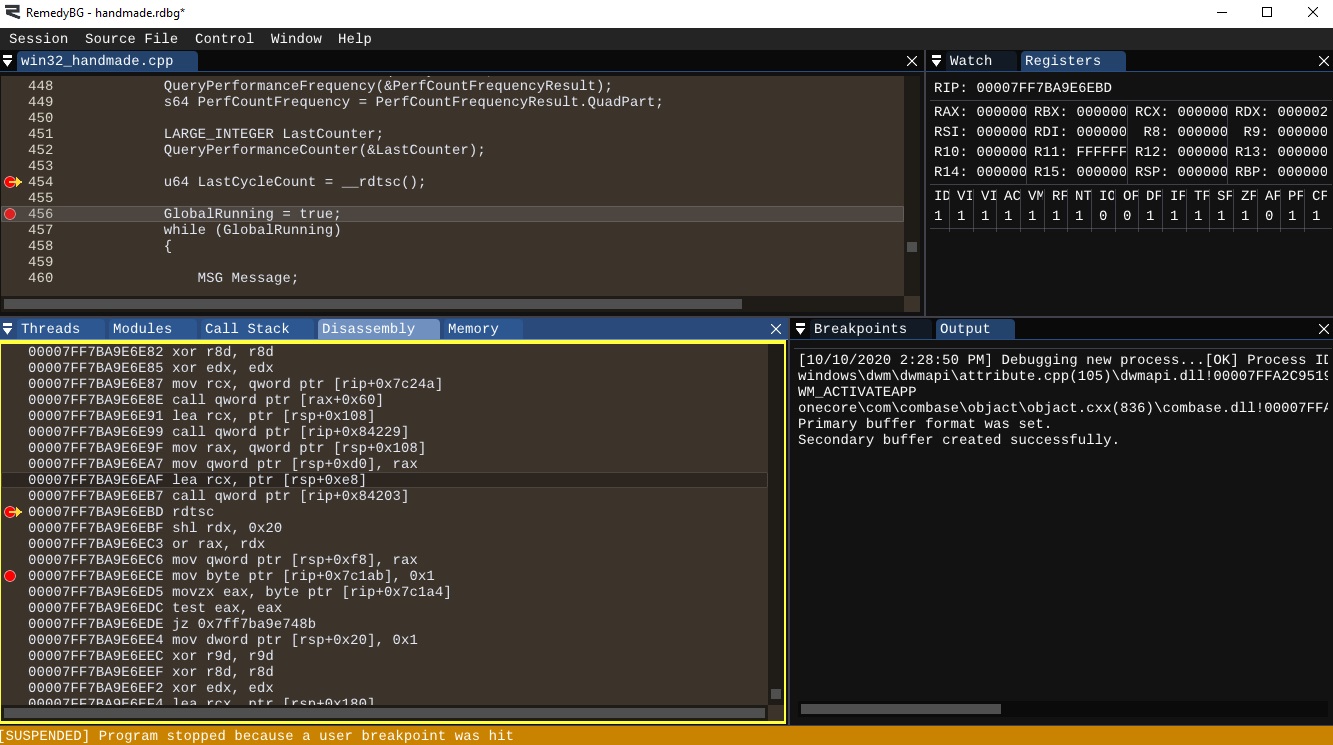
Instead of generating some assembly command like call (actually call some function), the instruction generated was straight-up rdtsc. The following instructions clean up the result of rdtsc and store them inside the variable we requested.
Quite handy.
(Back to Subsection 2.4)
Dimensional Analysis
If you aren't very familiar with math, the following section can get you thinking about things in a simple way.
If you have a specific amount of \(x\ counts\) (you could also imagine \(x \ counts\) as \(\frac{x\ counts}{1}\)), and a set value of \(\frac{counts}{seconds}\), how do you find the seconds? It's simple: just look at how the units cancel out on the divide.
If we were to multiply these two things together, we'd get.
$$\frac{x\ counts}{1}\times\frac{counts}{seconds} = \frac{counts^2}{seconds}$$
That's not what we want at all! Ok, let's try the other way. We want to cancel out the \(counts\) so we're just left with \(seconds\). We also know that if you divide 1 over a value, you get an inverse of it:
$$\frac{1}{\frac{counts}{seconds}} = \frac{seconds}{counts}$$
This means we can do the following conversion:
$$\frac{x\ counts}{1}\div\frac{counts}{seconds} = $$ $$\frac{x\ counts}{1}\times\frac{seconds}{counts} = $$ $$\frac{x\ counts \times seconds}{1 \times counts} = $$ $$\frac{x \bcancel {counts} \times seconds}{ \bcancel {counts}} = $$ $$x \ seconds$$
You can thus line up the whole string of things converting into each other. For instance, if you need to conver seconds in days, you can start thinking about it in the following way:
- Cancel out seconds, knowing that one minute contains 60 seconds.
- Cancel out minutes, knowing that one hour contains 60 minutes.
- Cancel out days, knowing that one day contains 24 hours.
Just by outlining this math the result becomes immideately visible:
$$x\ seconds \times \frac{1\ minutes}{60 seconds} \times \frac{1\ hours}{60 minutes} \times \frac{1\ days}{24 hours} = $$ $$x\ \frac{\bcancel{seconds}}{1} \times \frac{1 \bcancel{minutes}}{60 \bcancel{seconds}} \times \frac{1 \bcancel{hours}}{60 \bcancel{minutes}} \times \frac{1\ days}{24 \bcancel{hours}} = $$ $$ \frac{x\ seconds}{60 \times 60 \times 24} days$$
(Back to Subsection 2.1)
Division in C
C treats division differently based on the type of the items which are being divided.
For instance, if you divide an int with an int, it will be an int division, even if you store the result as a float. So if we have an int x, y;, a division of these will be treated as an integer divide. Of course, the integer has no fractional part, so it's simply discarded, not even rounded. Only after the operation is complete will the number converted to a float.
So, in order to get a proper floating-point division, you have to tell C first that we want to treat those integers as floats. And we do it by casting both operands as float before the division happens:
int x, y;

//...

float z = (float)x / (float)y;
If you do this way (or by using f32s we've defined last time), C understands that we're trying to do move these values into the floating point registers and do work on them there.
(Back to subsection 3.1)
Side Considerations
The Intel Architecture Reference Manual
You're going to need on your journey a guide. And, if you program for any length an x86-based architecture, you will require the Intel Architecture Reference Manual. This document, which you can download for free, does just the thing for you. Such a document goes through every little detail of their processors and, since the x86-64 architecture is shared, it also applies to AMD processors of the same type, as well.
We're mostly going to be concerned about Volume 2 contents, but the other volumes are interesting as well! Take a look at least at the table of contents to see what's it all about. It really tells how things work inside a processor.
Even more specifically, we want to take interest of the chapters covering the Instruction Set Reference. This reference shows all the available intrinsic functions, i.e. the functions incorporated inside the processor. Why would you care about them? Intrinsics make the common tasks you might want to do, fast. Blazingly fast.
But even more than that. If you go through the disassembly, and you'd like for example know more about what that mov instruction, you can look at the guide and get detailed information about it.
(Back to subsection 1.1)
Recap
Navigation
Previous: Day 9. Variable-Pitch Sine Wave Output
Up Next: Day 11. The Basics of Platform API Design
- Dimensional Analysis
- Intrinsics
- Processor Clock
- Unions
- Wall Clock
Intel Architecture Reference Manual
A matter of precision (by Tom Forsyth)